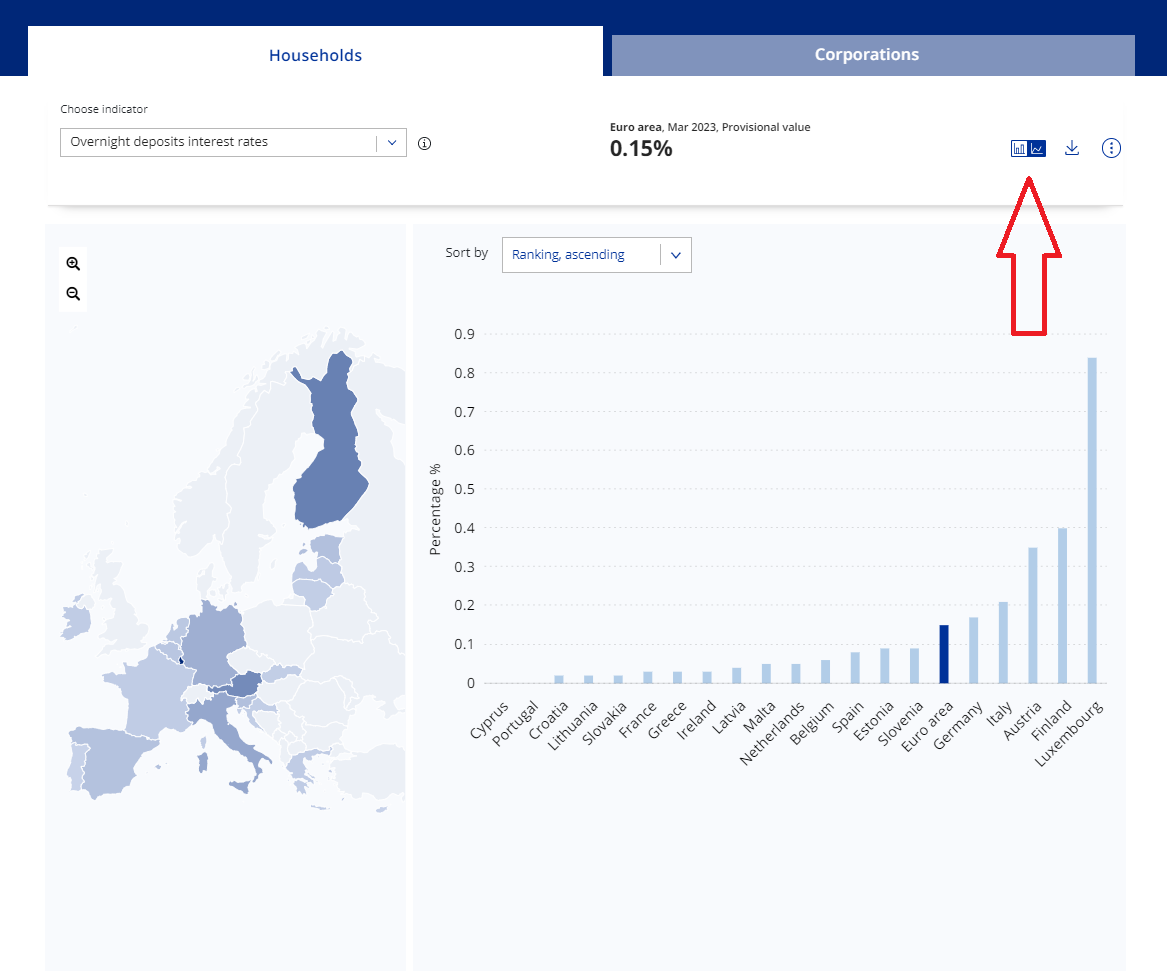
Help Browse graphs articles Exploring Main figures Exploring time series page Exploring data comparison Downloading data Data Graphs Search Account API Contact us Browse Data Graphs Search Account API Contact us Browse graphs articles Switch between trends and rankings views If your indicator is displayed using the map and bar dashboard, you also have the option to view the data over time in a trends chart. Here you can select or deselect geographical areas to visualise in the trends by clicking on Add country. Switching between trends and rankings views Image ⏎ Back × Login Register Login Email Password Remember me Forgot your password? Register Register to manage and store your data, data comparisons as favourites, create personalised dashboards or subscribe to email notifications on data updates. Email Password ? Confirm password In what context do you use ECB Data Portal? Please choose oneBusiness professionalEconomic enthusiastJournalistResearcher/AcademicStudentTeacher I acknowledge I agree to the use of my personal data as described in the Data Privacy Statement. Refresh