


How do I create dashboards?
You can easily create dashboards with your ECB Data Portal account to visually monitor data stored in your favourite data lists.
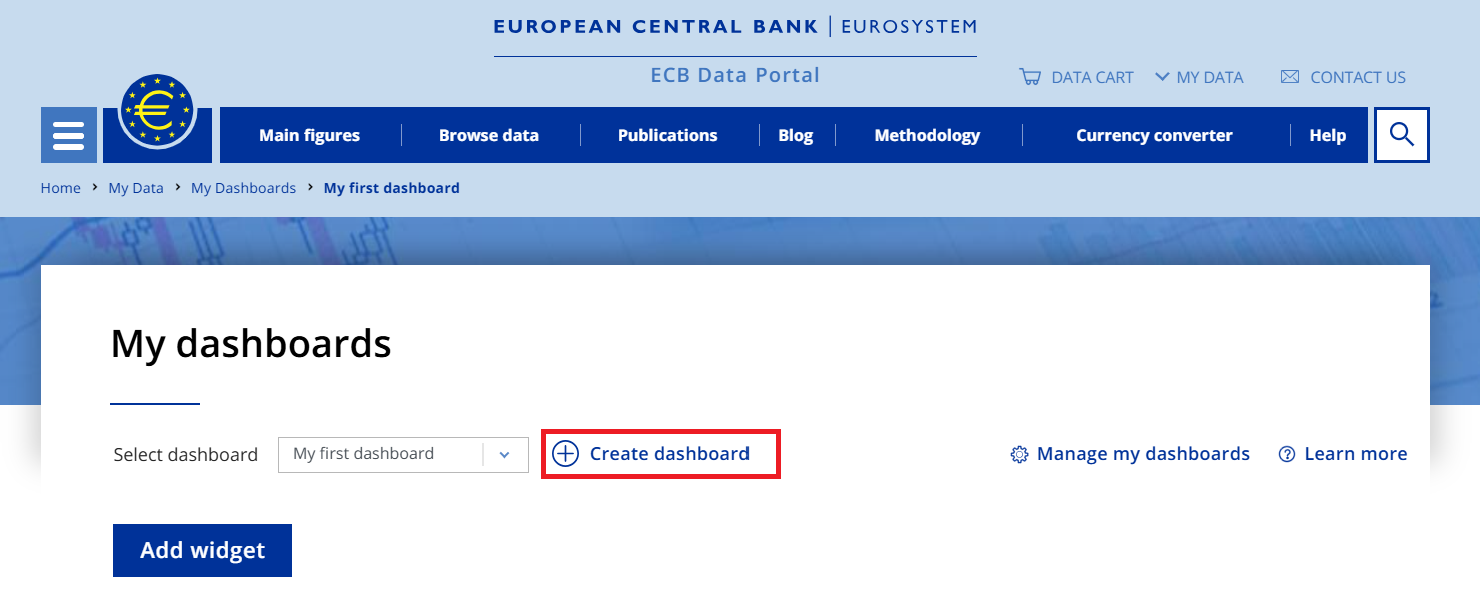
Go to "My dashboard" and click on "Create dashboard" as a first step.
Create dashboard
Now you are ready to start adding widgets by clicking on "Add widget". Select time series from your favourite data list that you stored earlier.
Select time series

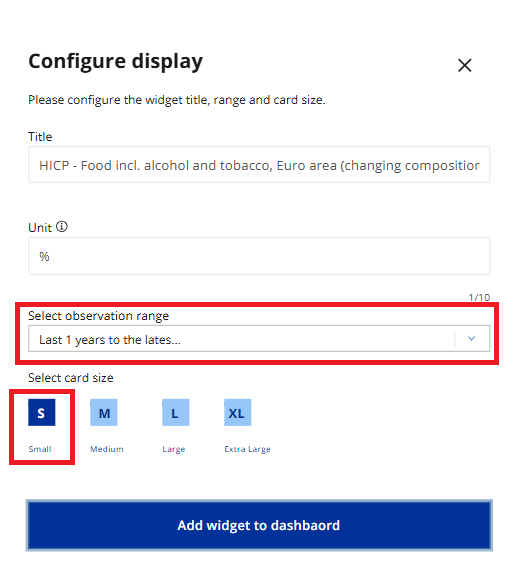
As a next step, configure the chart display by choosing the size of widget (S, M, L and XL) on the dashboard. The larger the size of the widget is, more observations it can display. For example by choosing size "S" only the last value will be displayed, while choosing size "XL", the full time range can be displayed. Furthermore, you may edit the default title and unit of time series, too.
Configure chart display
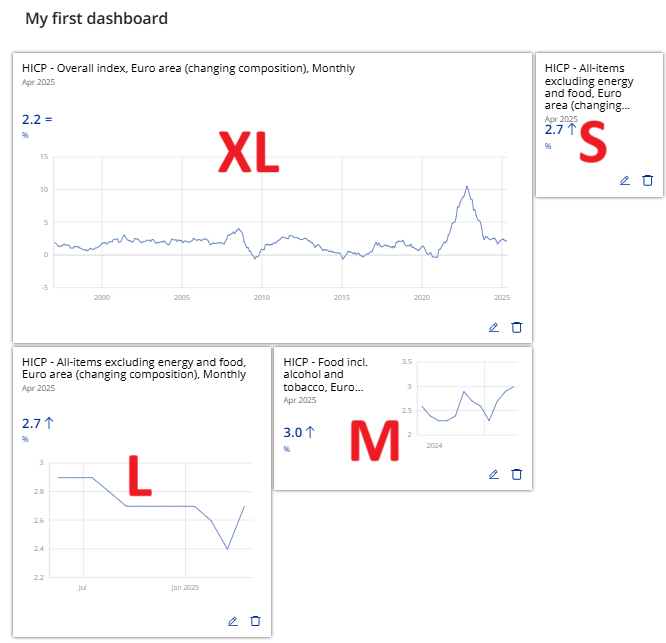
Find below the size guide of the different Widgets and those display.
Widget size guide
To manage existing Widgets on your dashboard, click on "Edit" icon.
Important note: The data displayed on your dashboard will automatically refresh with new data releases, therefore you can live monitor your favourite indicators.