17 September 2024
By Maciej Anacki, Ana Aragonés, Giuditta Calussi and Hans Olsson
The ECB has started releasing more detailed data on household holdings of investment fund shares, including breakdowns by underlying asset and counterpart sector. These data can be used to assess households’ risk exposure patterns, inform monetary policy, and conduct research on investment trends and behaviours.
The data are part of the Quarterly Sector Accounts (QSA) [1], which contain information on how the main sectors of the economy, including households, save and invest their money.
Investment funds allow investors to invest in a large variety of assets without buying them directly. They account for over 13% of households’ total financial assets and constitute the third-largest counterpart sector, after banks (mainly through deposits) and insurance corporations (life insurance). Households also have significant exposures to pension funds (via pension plans) and corporations (shares and other equity, including ownership in private businesses).
Investment funds as a gateway to foreign assets
Chart 1 shows the latest data (Q1 2024) on financial assets directly held by euro area households vis-à-vis counterpart sectors, and the resulting breakdown after distributing investment fund shares according to their underlying assets[2].
The most striking difference is the increase for the rest of the world from 2.8% of households’ total financial assets[3] – when considering only the direct counterpart – to 9.8%, a result of euro area households’ investment in, for instance US shares, via investment funds resident in the euro area.
This shows that households use investment funds as a gateway to invest in foreign assets, which may otherwise be costly or challenging for them to acquire. It highlights the role investment funds play in helping households access a variety of investment opportunities.
Use the 'change country' dropdown menu to access the same data for households residing in individual euro area countries.
Analysing the results for individual euro area countries
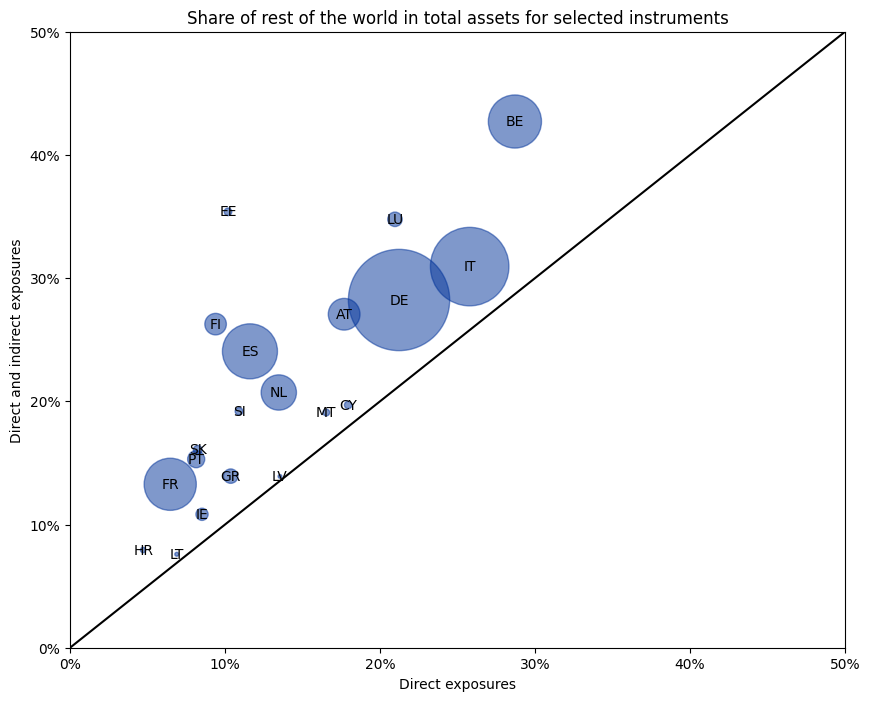
Chart 2 shows that, in almost all euro area countries, the share of foreign assets increases when indirect exposures are included.
For example, foreign assets make up 11% of Spanish households’ total financial assets when considering only the direct counterpart. This increases to 24% after distributing the investment fund shares/units.
Belgium, Luxembourg, Estonia and Finland show the largest increases in holdings in the rest of the world after including indirect holdings, as indicated by their positions furthest from the diagonal line in the chart.
Also, one might expect households from countries with bigger or more developed financial markets to invest less abroad, but this is not the case, as can be seen from the very different placement of countries like France, Germany and Italy in Chart 2.
A more detailed analysis of home bias and investment funds can be found in a recent ECB Working Paper.
Chart 2
Note: The size of the circle represents the stock of household financial assets, Q1 2024 end-of-period stocks.
In this context, it is imporant to note that the share of foreign assets is significantly lower for the euro area as a whole than for individual euro area countries. This is because the “rest of the world” is not the same for the euro area as for individual countries.
For example, when Spanish households invest in Luxembourgish investment fund shares, this is a cross-border investment from a Spanish perspective, but a domestic investment from a euro area perspective.
If this Luxembourgish fund buys German government bonds, it is again a cross-border investment for the Spanish households, but not for the euro area as a whole. In general, investment funds contribute to financial integration of the euro area since they tend to hold portfolios that are diversified across countries, as explained in greater detail in this Economic Bulletin article.
[1] The QSA combines data from several datasets for the look-through calculation: securities holding statistics by sector (SHSS), investment fund statistics (IVF), and financial accounts (FA) data.
[2] The chart refers to financial instruments for which the counterpart sector breakdown is available: deposits, loans, debt securities, listed shares and investment fund shares/units. The counterpart sector breakdown for insurance, pension and standardised guarantee schemes (F.6) is exlcuded from the chart but availble as an estimate for the euro area. Currency, unlisted shares, other equity, financial derivatives, other accounts receivable and non-financial assets (mainly real estate) are not included (see also the methodological note 'Extension of the who-to-whom presentation to insurance and pension assets'). Discrepancies between totals and their components may arise from rounding.
[3] Referring only to those financial instruments for which the counterpart sector breakdown is available: deposits, loans, debt securities, listed shares and investment fund shares/units.
Further information
ECB Economic Bulletin article: Is the home bias biased? New evidence from the investment fund sector
Working Paper: Is home bias biased? New evidence from the investment fund sector
Extension of the who-to-whom presentation to insurance and pension assets
Related statistics
Securities holding statistics by sector
The views expressed in each article are those of the authors and do not necessarily represent the views of the European Central Bank and the Eurosystem.
