Analysing wealth distribution in the euro area


29 May 2024
By Nina Blatnik, Luisa Collina and Linda Kezbere
Monetary policy can have an impact on the distribution of wealth within society. Changes in the wealth distribution may affect the transmission of monetary policy and financial stability. Central banks therefore need accurate and timely information on wealth distribution and how it changes over time. The recently published Distributional Wealth Accounts (DWA) are a new data source for analysing these questions. This blog post provides details on the new dataset and how it compares with other data that are used to analyse wealth distribution.
The DWA combine data from two existing sources: they use distributional information at household level from the Household Finance and Consumption Survey (HFCS) and combine it with macroeconomic data from the quarterly sector accounts (QSA).
By linking these two datasets, it is possible to provide both detailed insights into wealth distribution on a quarterly basis and data that are aligned with broader economic figures.
Distributional Wealth Accounts (DWA) or Household Financial and Consumption Survey (HFCS) – two datasets on wealth distribution
While both the DWA and the HFCS track household wealth distribution, they come with different features and can be used for different analytical and research purposes.
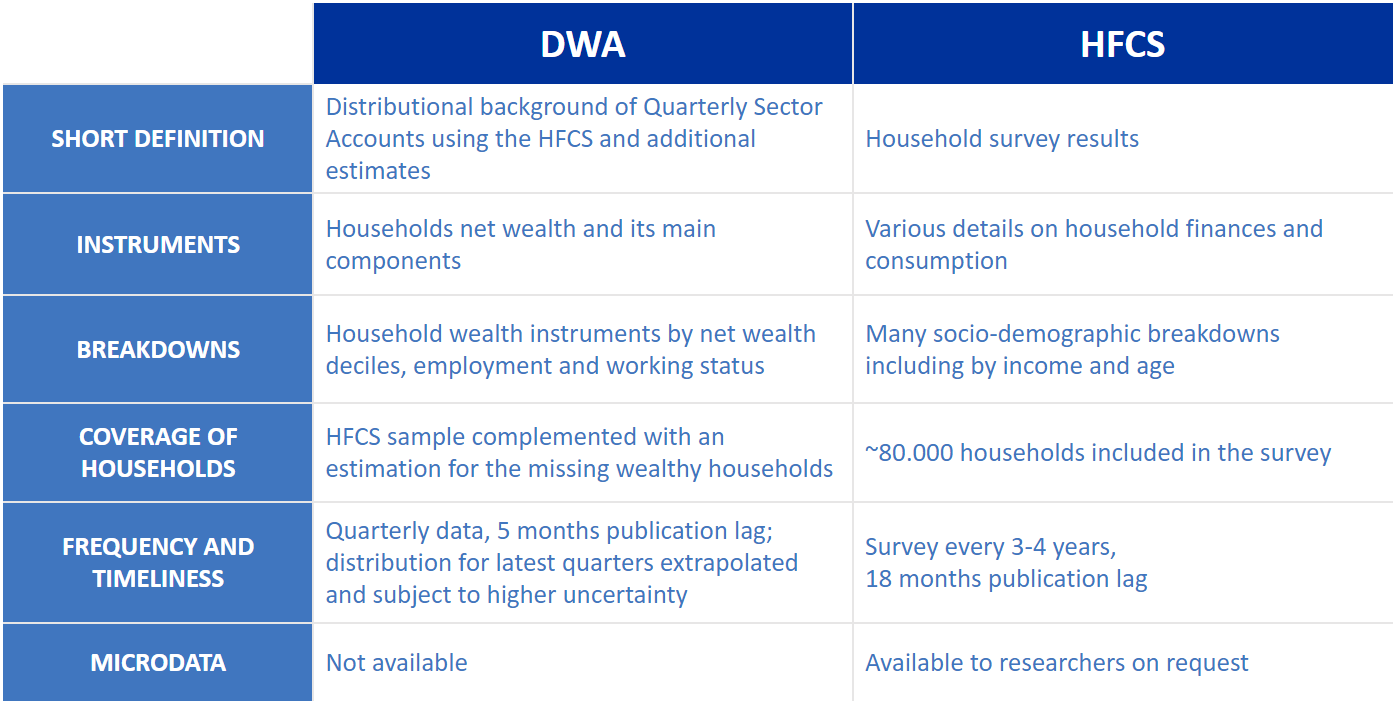
On the one hand, the DWA provide timely quarterly distributional information aligned with the macroeconomic aggregates on wealth and debt, along with its main components. The data are broken down by net wealth groups, employment and working status.
The HFCS, on the other hand, provides survey results of representative samples of households every 3-4 years, with an 18-month lag. It offers various details of household finances and consumption together with many socio-demographic variables (Table 1).
Table 1: Main features of DWA and HFCS datasets
Recent trends in wealth distribution
Looking into recent DWA data, it is possible to analyse the effects of, for example, growing housing wealth and the rising value of listed shares on the distribution of household wealth. The data show that the increase in housing wealth in recent years has been more equally distributed than the increase in the value of listed shares (Charts 1 and 2).
The significant rise in euro area household net wealth observed in national accounts over the past five years (28% or about €13.0 trillion) was accompanied by a slight decrease in inequality.
One reason is that homeowners, who account for more than 60% of the population, benefited from increased housing prices. Their net wealth per household increased by 25% over this period. In parallel, the net wealth of non-homeowners, making up 40% of the population, grew by 19%, mainly visible in the rise in deposits observed over this period.
Analysing such trends can help to assess the impact of the ECB’s quantitative easing programme on the wealth of households and its distribution. The datasets can similarly be used to analyse developments in household wealth distribution in the euro area during a period of rising interest rates. Beyond central banking, they can also be used by policymakers when designing policies targeted towards specific households and fostering inclusive growth.
Further information
Press release: "ECB publishes new statistics on the distribution of household wealth"
Related statistics
Distributional Wealth Accounts
Quarterly sector accounts (QSA)
Household Finance and Consumption Survey (HFCS)
The views expressed in each article are those of the authors and do not necessarily represent the views of the European Central Bank and the Eurosystem.