


Browse
Selecting indicators to visualise in the dashboard
With the regional chart you can geographically compare your selected indicator with the rest of the euro area countries.
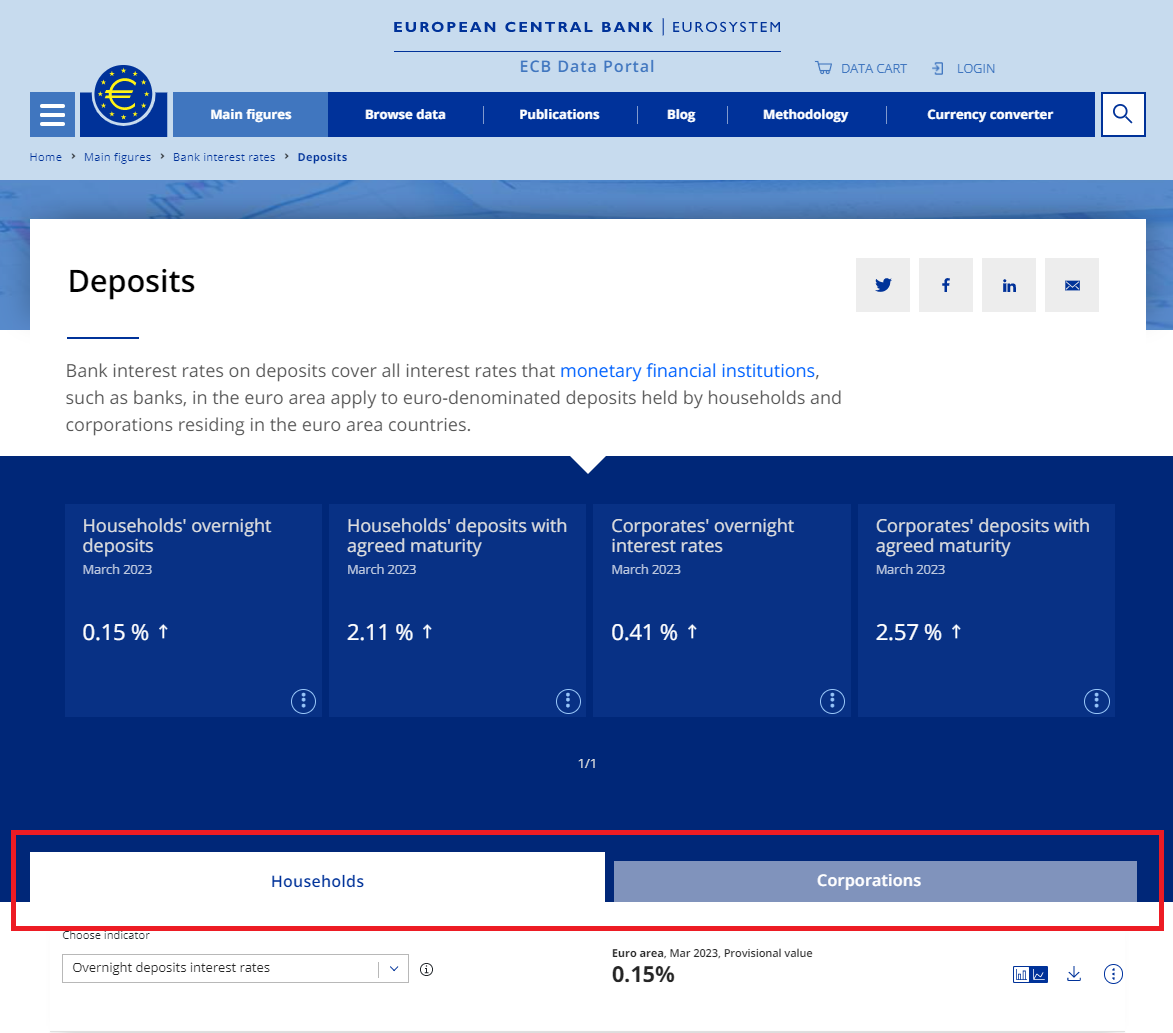
First you can select which indicator groups (e.g. Corporations or Households) you wish to look at more closely by clicking on the corresponding tab.
Main figures tabs
Image
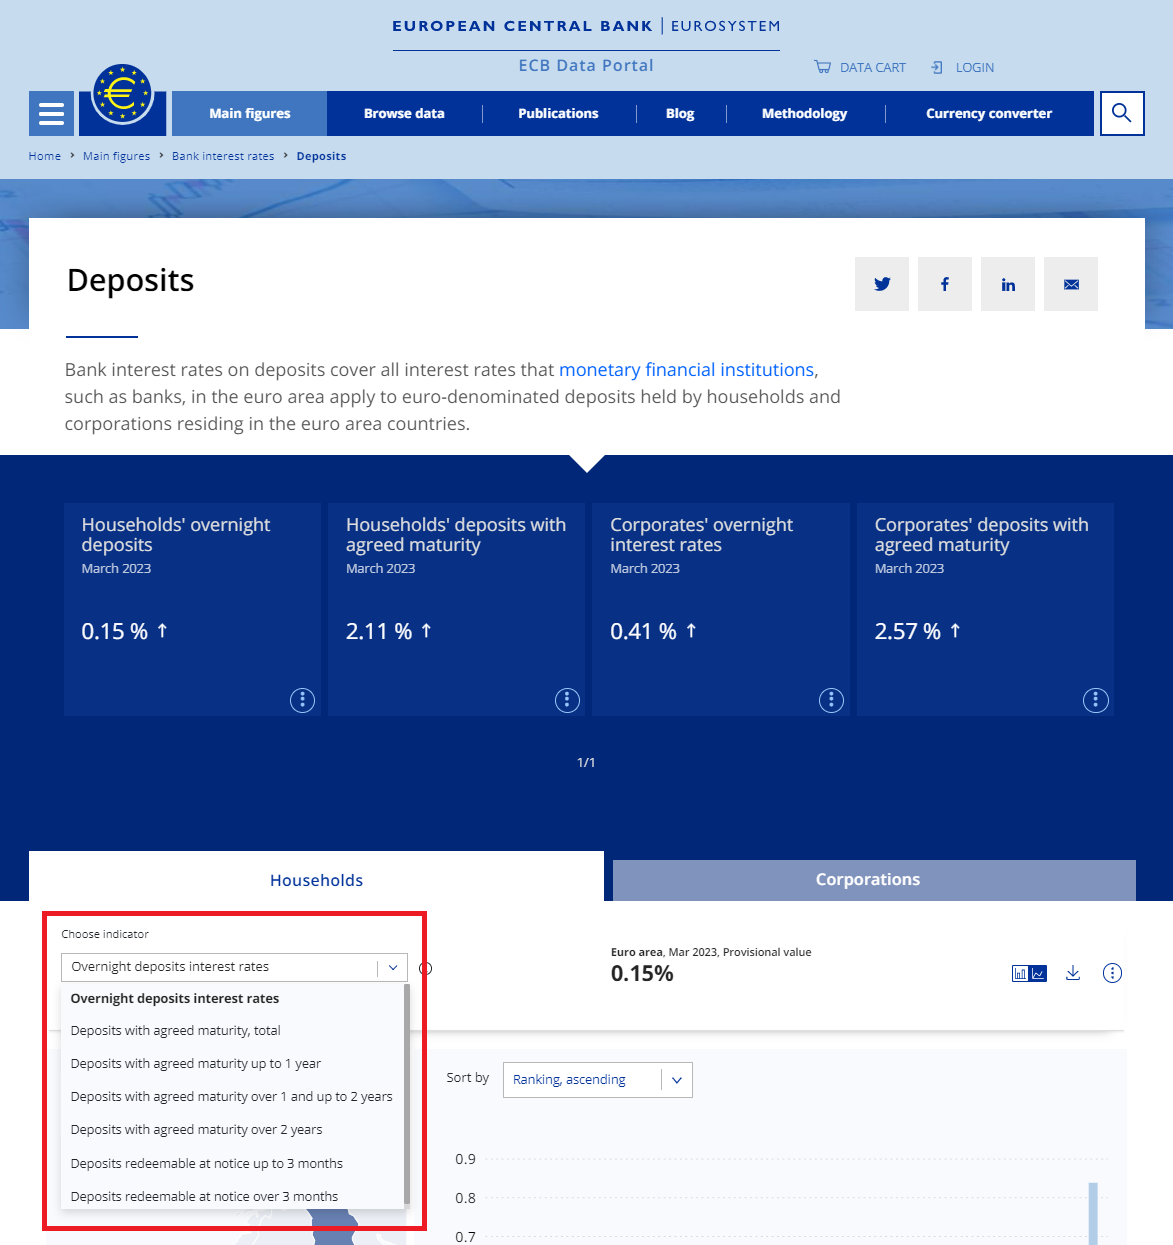
Click on the drop-down icon Choose indicator to select the indicator you wish to visualise.
Main figures indicators
Image
For any of the charts you can find the associated data point for a country by hovering over it. From here you can go to a new page to find detailed information about the country data.