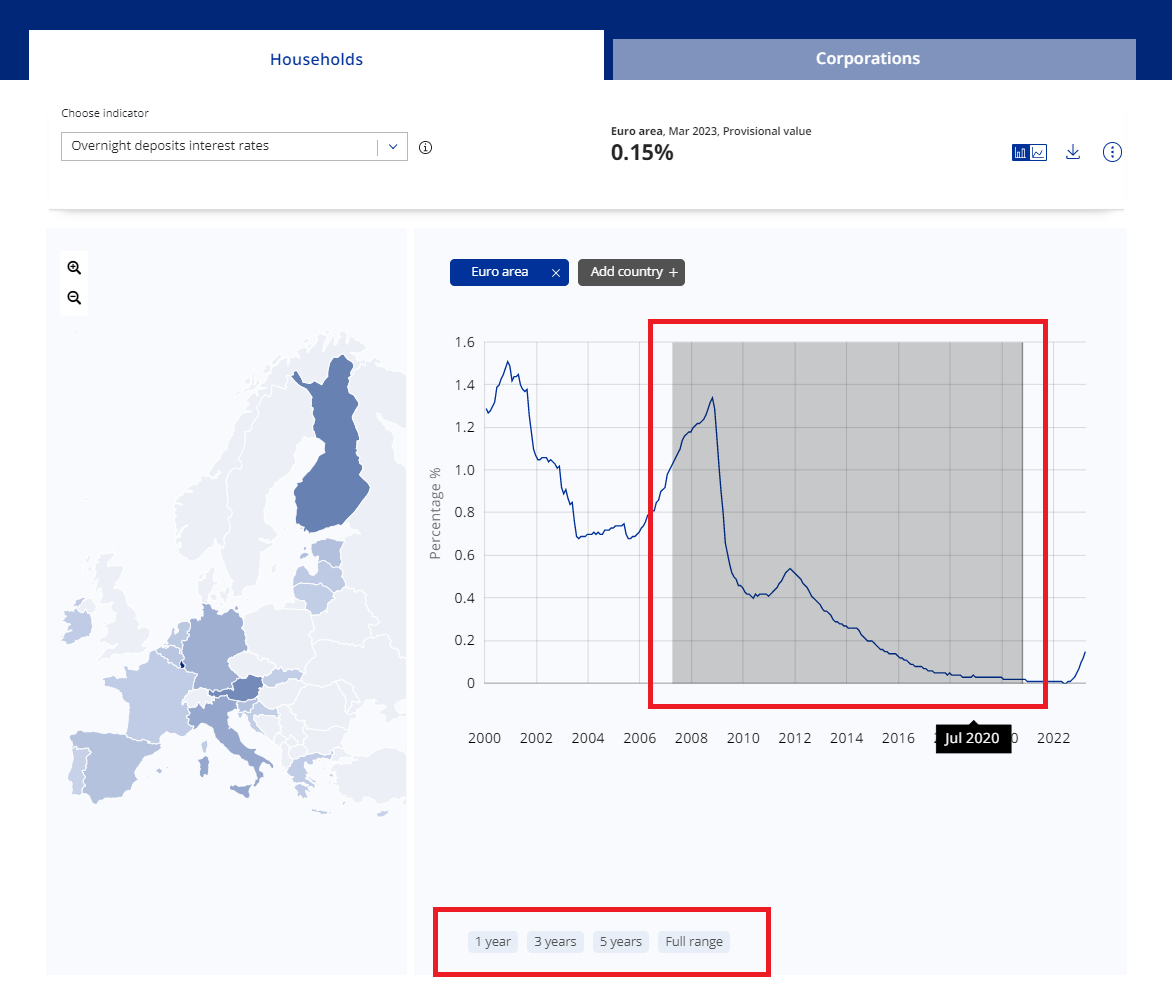
Help Browse graphs articles Exploring Main figures Exploring time series page Exploring data comparison Downloading data Data Graphs Search Account API Contact us Browse Data Graphs Search Account API Contact us Browse graphs articles Change time range You can decide to show a specific time range of your time series in the trends view. You can do this in two ways. Choose the pre-selected time ranges below the chart. Click, hold and drag over the specific area you wish to visualise in your data comparison. Change time range Image ⏎ Back × Login Register Login Email Password Remember me Forgot your password? Register Register to manage and store your data, data comparisons as favourites, create personalised dashboards or subscribe to email notifications on data updates. Email Password ? Confirm password In what context do you use ECB Data Portal? Please choose oneBusiness professionalEconomic enthusiastJournalistResearcher/AcademicStudentTeacher I acknowledge I agree to the use of my personal data as described in the Data Privacy Statement. Refresh Nothing in data comparison Discard data comparison? × Are you sure you want to discard the comparison? As a registered user you can save data comparisons in your favourites. Discard