Browse
Adding time series from charts and dashboards
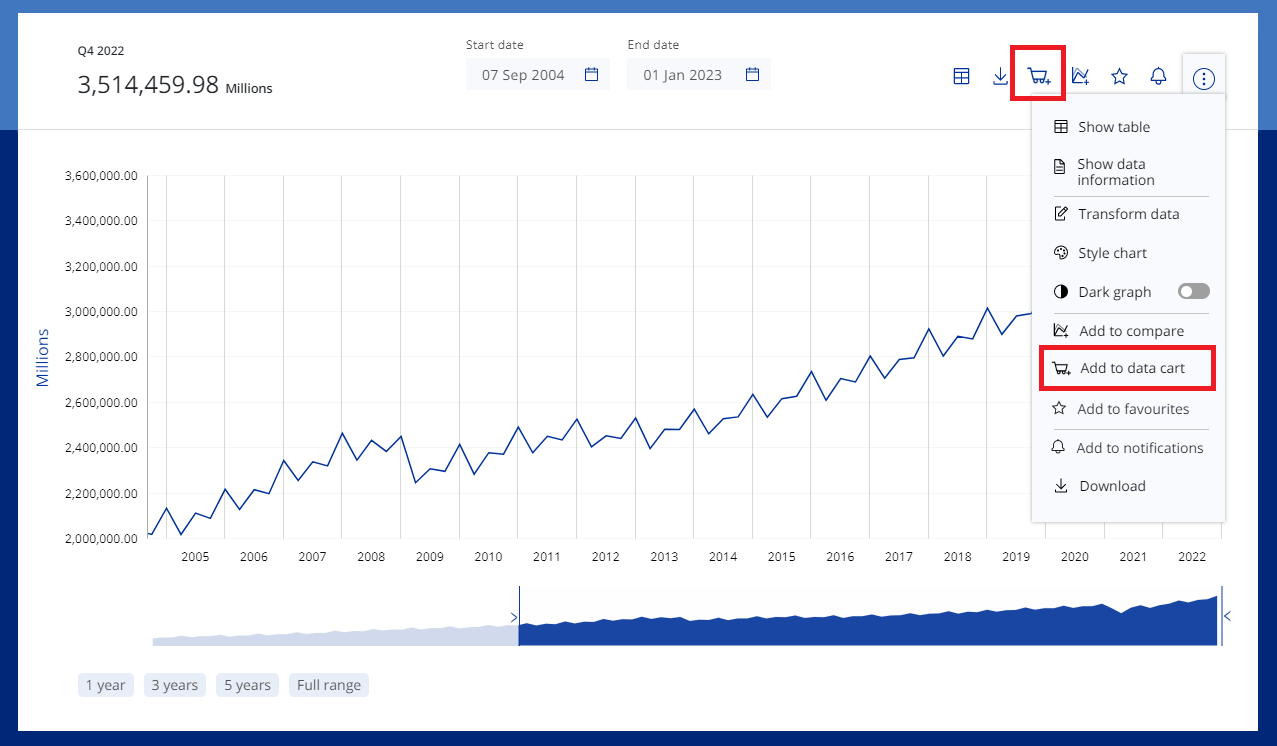
You can add visualised data to the data cart by locating the Add to data cart icon above the chart area. You can also find this icon by clicking on the Menu icon and selecting it from the drop-down menu.
Add to data cart
Image
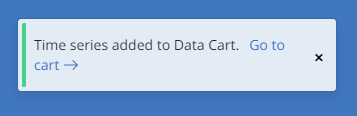
A pop-up in the bottom-right corner will confirm that your data has been included in the data cart.
Data cart pop-up
Image