Rebound in short-term debt securities issuance


16 August 2023
By Martina Viggiano and Johannes Kleibl
Issuers of debt securities in the euro area have recently adjusted their financing choices in favour of securities with shorter maturities. This is one of the insights from the euro area securities issues statistics (CSEC).
Average monthly net issuances of long-term debt securities (i.e. those with an original maturity of more than one year) increased moderately to around EUR 84 billion in the period from August 2022 to July 2023 compared to EUR 74 billion in the preceding twelve months. In contrast, the increase in the average monthly net issuances of short-term debt securities (i.e. those with an original maturity of up to one year) is more pronounced. The net issuance of these securities increased from EUR -12 billion in the first period (from August 2021 to July 2022) to EUR +9 billion in the 12 months ending in July 2023.
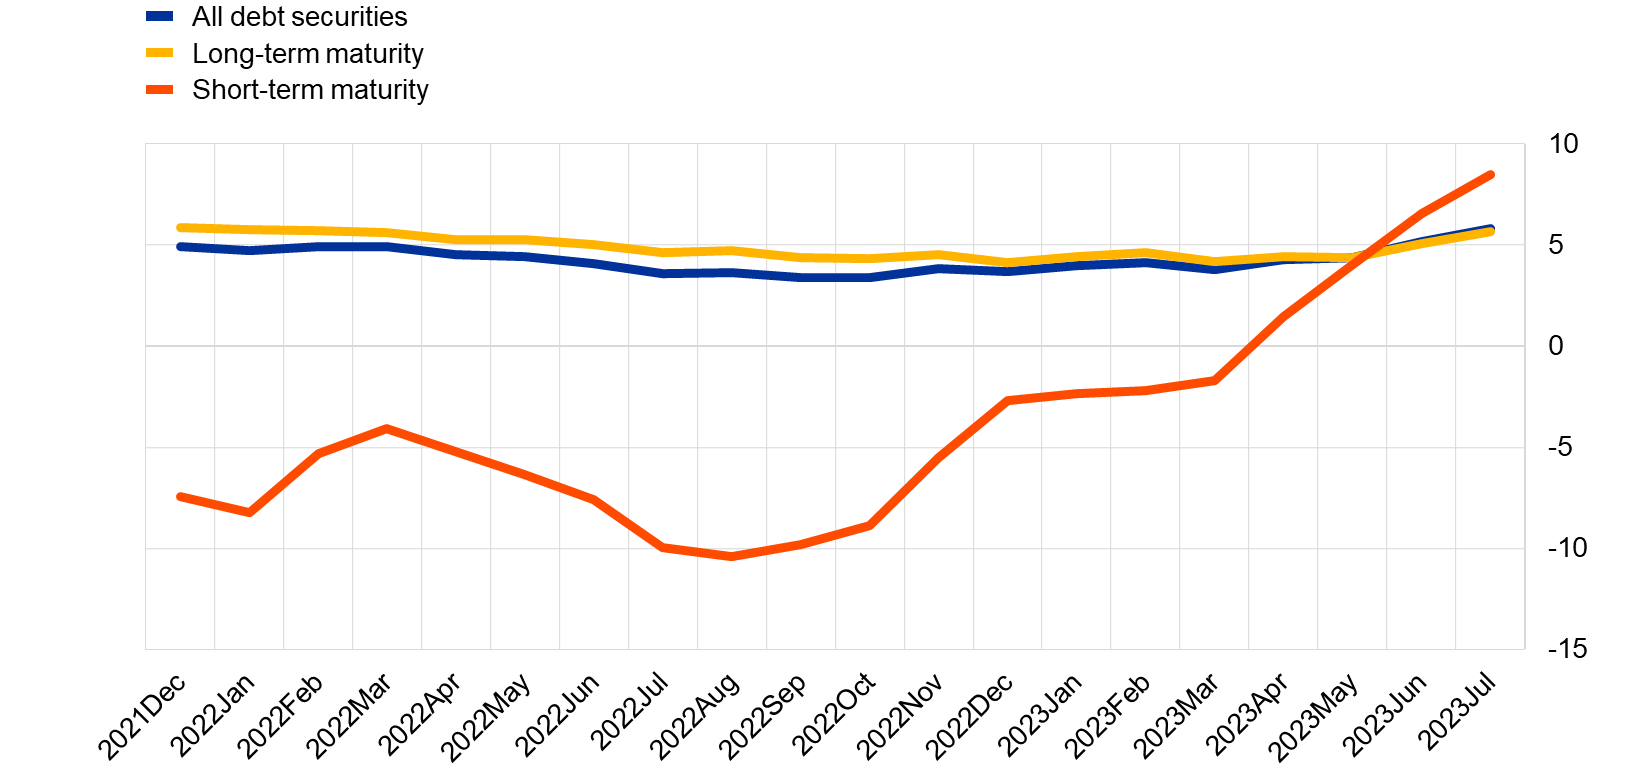
As shown in Chart 1, this translated into annual growth rates[1] of issuances of long-term debt securities of between 4% and 6% since December 2021. On the other hand, annual growth rates of issuances of short-term debt securities have increased significantly, from -10% in July 2022 to 9% in July 2023, surging above zero in April 2023.
Chart 1
Annual growth rates of debt securities issuances in the euro area by original maturity
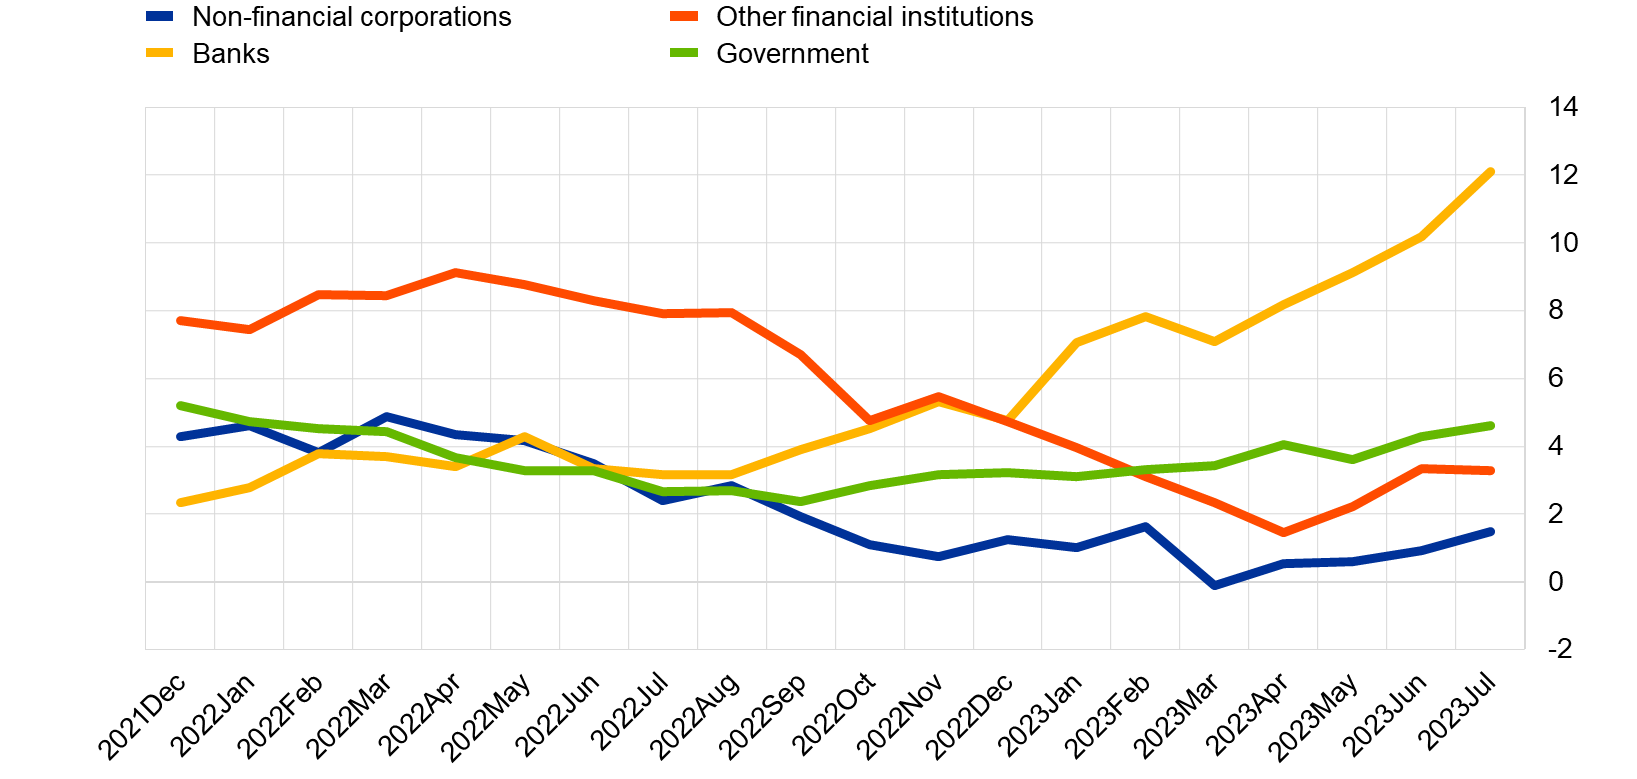
The various institutional sectors have also behaved differently, as shown in Chart 2. Annual growth rates of debt securities issuances by euro area banks have increased significantly over the last year, from 3% in July 2022 to 12% in July 2023 (corresponding to an increase of average monthly net issuances from EUR 12 billion to EUR 44 billion when comparing the period from August 2021 to July 2022 with the period from August 2022 to July 2023). At the same time, the annual growth rates for issuances by non-financial corporations and non-bank financial corporations decreased over the same period, possibly reflecting lower financing needs and/or less favourable financing conditions.
Chart 2
Annual growth rates of debt securities issuances in the euro area by issuer sector
[1] For details on how annual growth rates are calculated, see the section on “Calculation of growth rates for debt securities and listed shares” in the Technical Notes.
Related statistics
Securities Issues Statistics (CSEC)
The views expressed in each article are those of the authors and do not necessarily represent the views of the European Central Bank and the Eurosystem.